How to Report at Work: A High-ROI Skill
Many people carry an unspoken thought: those who are good at reporting outperform those who are good at doing. The person who writes the PPT gets promoted; the person doing the work keeps working overtime. This isn’t a joke — it’s the reality in many teams. But before complaining about unfairness, consider one thing: reporting is itself a skill, and one with an extremely high ROI.
1. Face a Brutal Fact First
In most teams, your leader’s perception of you = the part you report. You do 100 points of work, but if you report only 30, you’re a 30-pointer in your leader’s eyes.
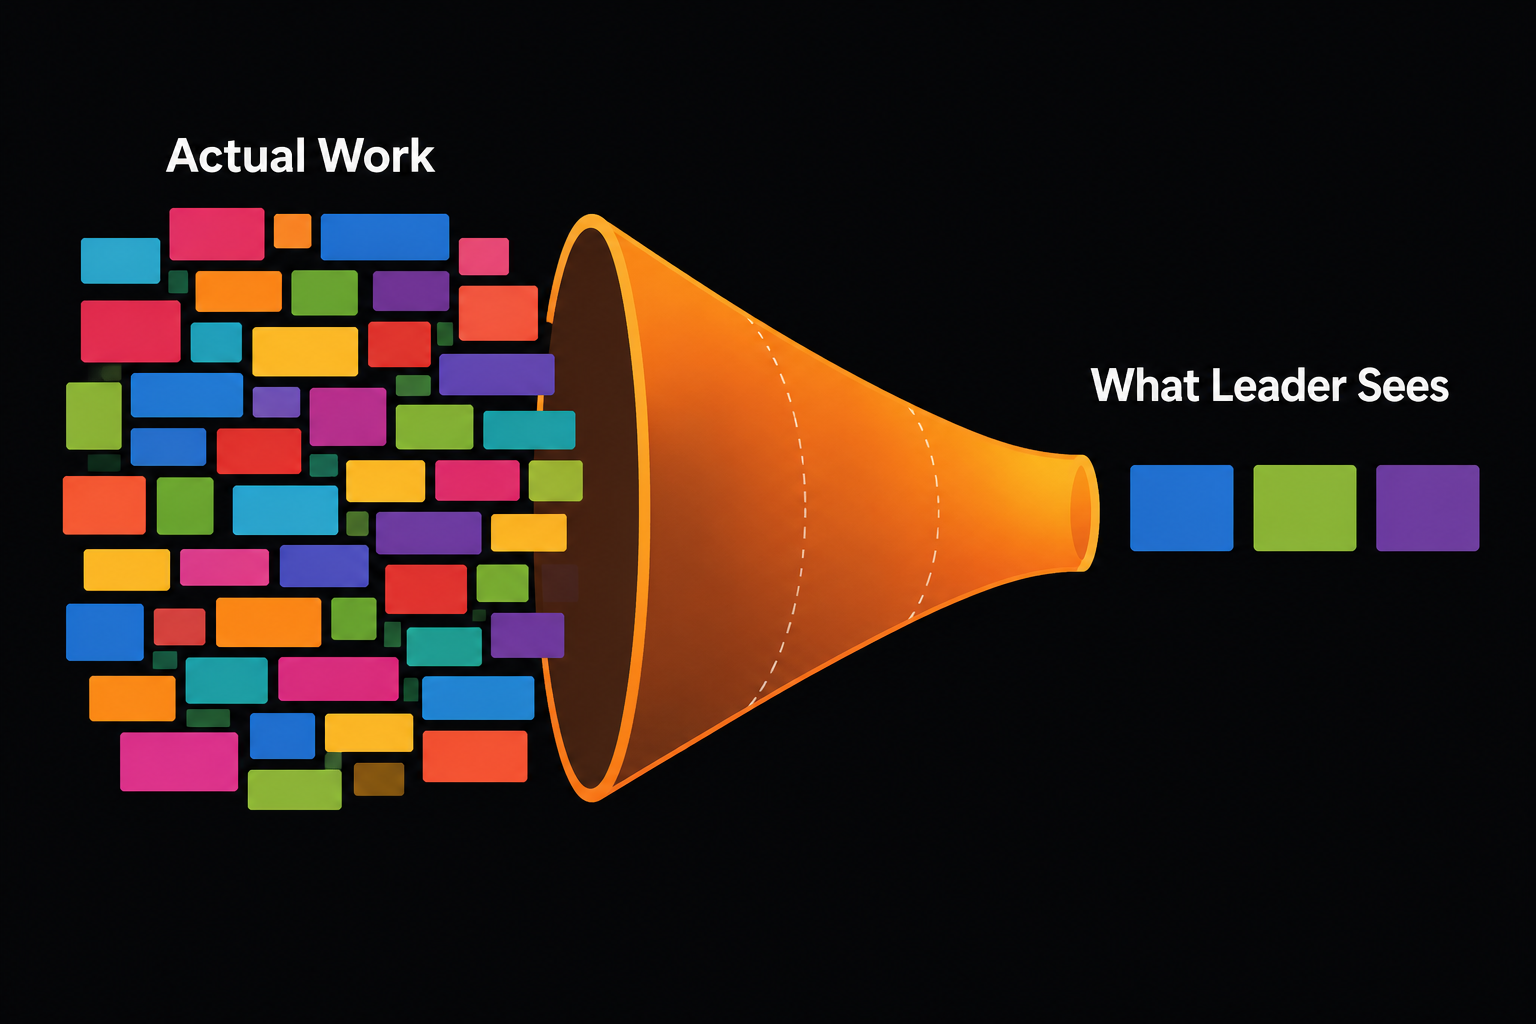
This isn’t about “PPT theater” — it’s this:
| Dimension | No reporting | Good reporting |
|---|---|---|
| Leader’s perception | “He seems busy” | “He delivered XX this quarter, metrics up YY%” |
| Asking for resources | No data to back it up, can’t even ask | Evidence-based: ask for people, get people; ask for budget, get budget |
| Team influence | Silent work, nobody knows | Methodology is replicable, lifts the whole team |
| Personal growth | No retrospectives, lessons wasted | Every report is a structured retrospective |
Reporting isn’t “showing off” — it’s your information outlet in the organization. If you don’t say it, nobody knows.
2. The Four Traps Most People Fall Into
2.1 The Ledger — the Most Common Disease
❌ This week I finished the activity page, fixed two bugs, participated in code review, wrote docs...
Your leader’s internal OS: “So what? Which one matters most? Any risks?” You wrote 500 words and said nothing.
2.2 Effort Without Outcome
❌ I spent three days investigating a performance issue, read flame graphs, analyzed bundle size, compared three approaches...
Effort is your workload; results are your output. Your leader buys results, not your overtime hours.
2.3 Data Dump Without Interpretation
❌ FCP dropped from 406ms to 181ms, LCP from 1.06s to 348ms, bundle size from 861kb to 464kb
Numbers don’t tell stories. The leader sees three lines and thinks: “So did UX get better? How much better?” You have to answer for them.
2.4 No Follow-Through
Only retrospection, no outlook. The leader finishes reading and doesn’t know what you’ll do next, or whether you need help.
3. One Framework Is Enough
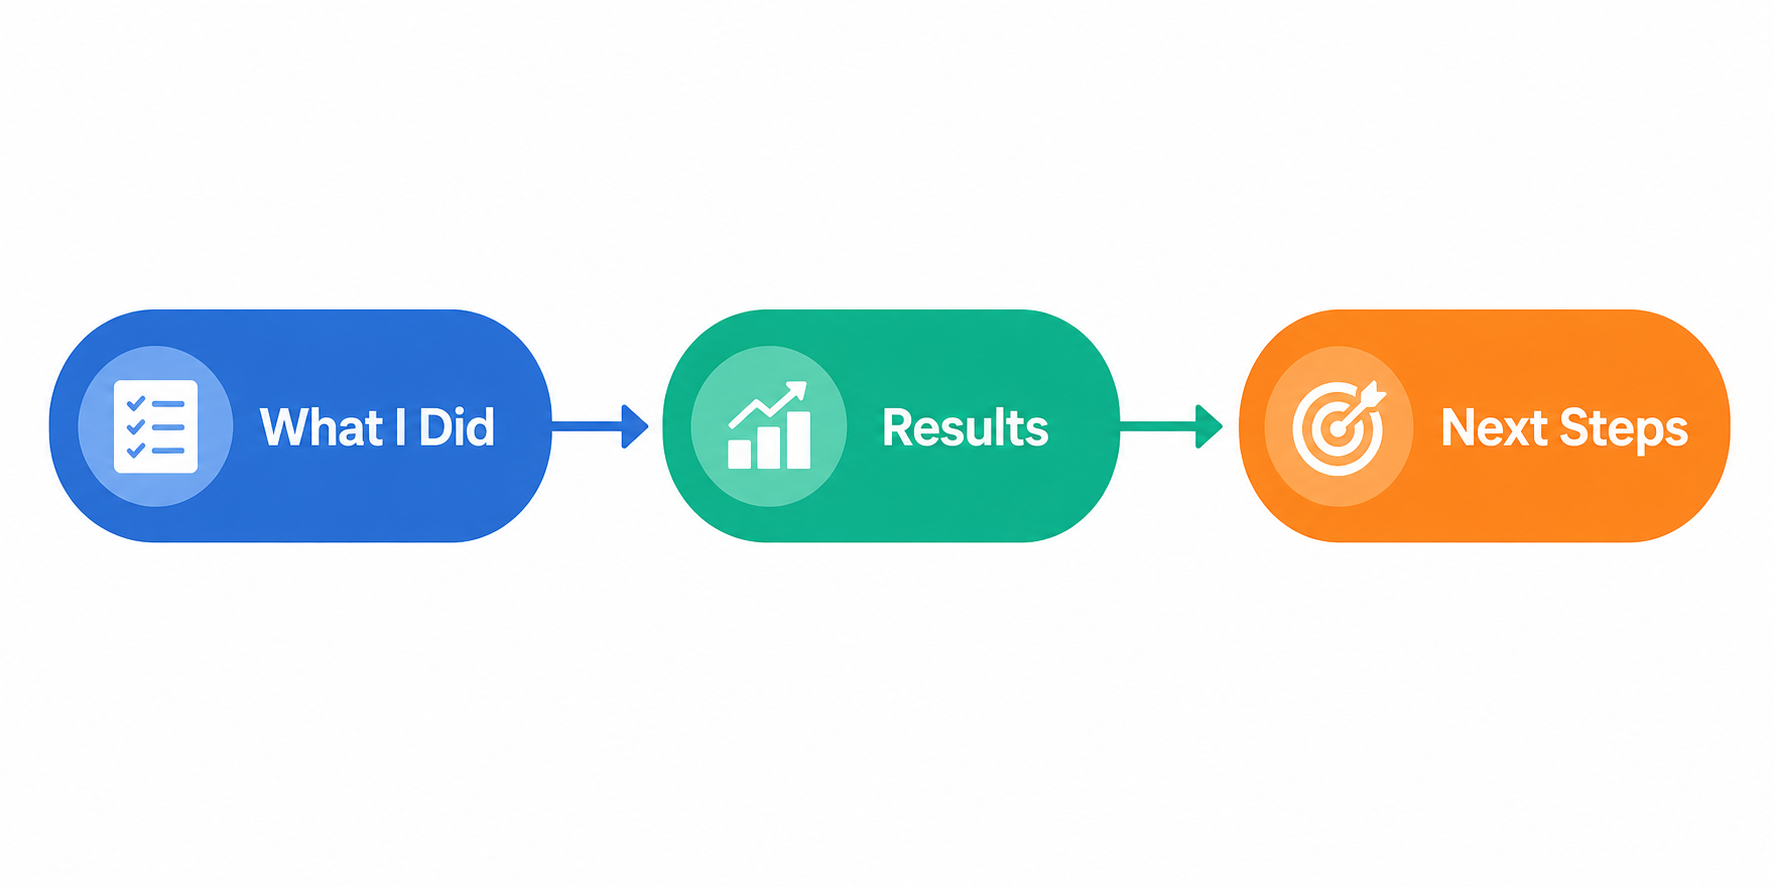
Don’t memorize a pile of methodologies — remember one:
What I did → What effect it had → What's next
3.1 STAR (Enough for Weekly/Monthly Reports)
| Element | One line | Example |
|---|---|---|
| Situation | Context | Activity page LCP 4.64s, users churning |
| Task | Task | Optimize to < 1.5s |
| Action | What you did | Avoid re-renders, code splitting, async loading |
| Result | Result | LCP 348ms, 67% faster |
3.2 The Pyramid (For Quarterly/Annual Reviews)
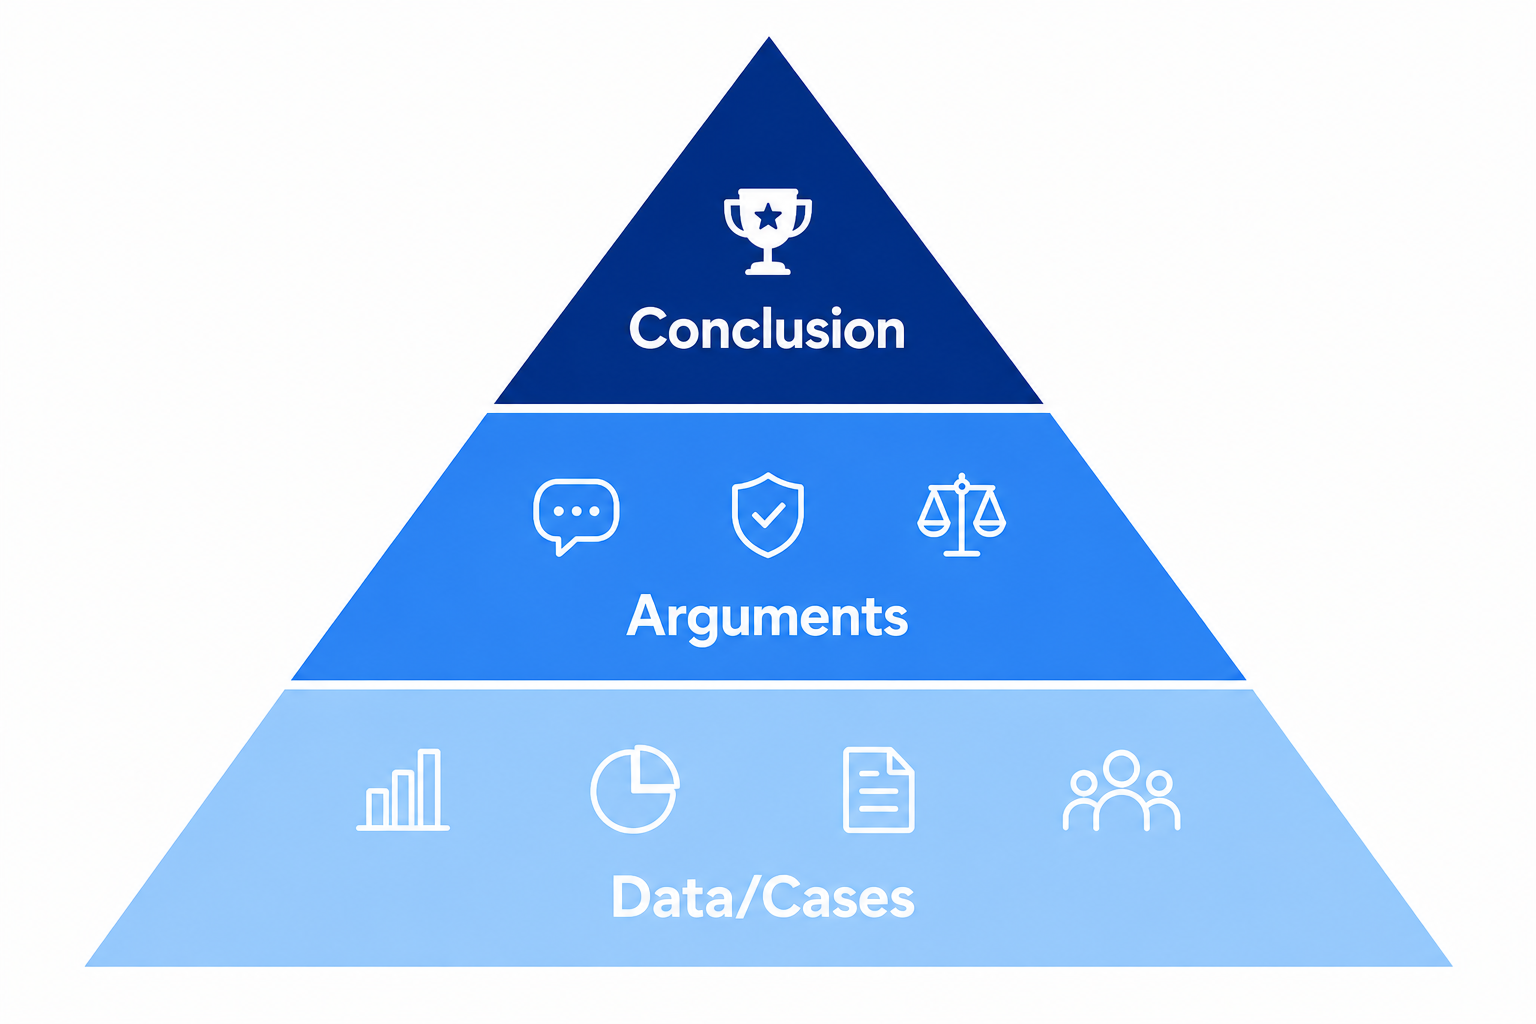
Conclusion first, then expand. The leader cares most about “so what”, not “how it was done”.
4. Different Scenarios, Different Playbooks
| Scenario | Frequency | What to emphasize | Length |
|---|---|---|---|
| Weekly report | Every week | Output + plan + blockers | 300–500 words |
| Monthly report | Every month | Goal attainment + data + retrospective | 800–1,500 words |
| Quarterly review | Every quarter | OKR + highlights + team + roadmap | 1,500–3,000 words |
| Tech talk | Ad hoc | Problem → solution → payoff → reusable | 20–40 minutes |
| Upward report | On demand | Business value + ask for resources + risks | Shorter is better |
Core rule: the higher up it goes, the more it cares about “so what”; the lower, the more it cares about “how”.
5. How to Write Data People Can Actually Read
5.1 Always Include a Comparison Baseline
❌ LCP 348ms
✅ LCP from 1.06s → 348ms (↓67%), beats the 1.5s target
5.2 Translate Into Business Language
❌ Main bundle down from 861kb to 464kb
✅ Main bundle halved; first screen ~2s faster on slow networks; bounce rate estimated down 15%
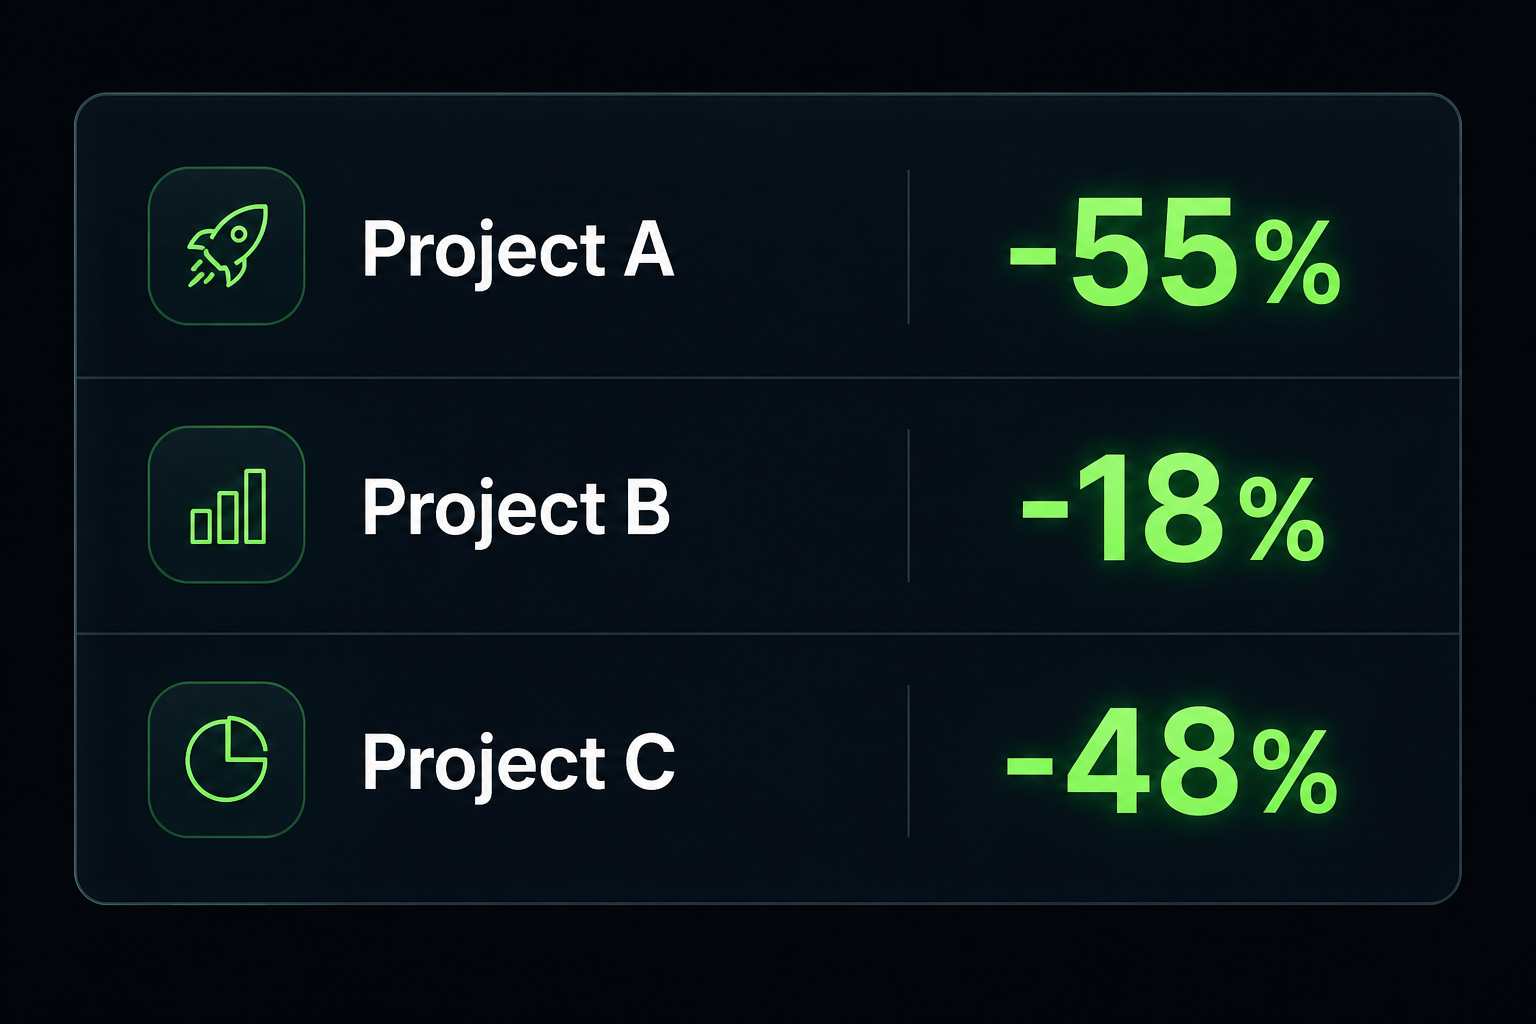
5.3 Use Tables for Multi-Dimension Comparison
5.4 No Metrics? Create Them — or Don’t Do It
This is the part most people miss: an optimization without before/after metrics is work done in vain when it comes to reporting.
The real scenario: the dirty-work dilemma
Refactoring legacy code, paying off tech debt, cleaning up redundant config — satisfying to do, awkward to report:
❌ This week I refactored the old-layout module, split 12 components, and removed 300 lines of dead code
Leader’s internal OS: “So what? Did users notice? Did performance improve? Did production bugs decrease?”
Three days of work, one sentence, and it lands flat.
What to do: create metrics first, then do the work
Dirty work isn’t forbidden — you just have to figure out “how to prove its value” before you start.
| Type of dirty work | Metrics you can create | How to write it up |
|---|---|---|
| Refactoring a legacy module | Build time, bug count in that module, code complexity | After refactor: build time ↓20%, zero bugs in that module for 3 straight months |
| Cleaning redundant deps | Bundle size, dependency count, install time | Removed 15 unused deps: main bundle ↓80kb, yarn install 12s faster |
| Enforcing code standards | Lint error count, CR revision rounds | Lint errors from 47 to 0; CR revisions ↓40% on average |
| Migrating tech stacks | Maintenance cost of the old stack, onboarding time | New-hire onboarding cut from 2 weeks to 3 days |
| Config/process optimization | Number of steps, error frequency | Config flow trimmed from 12 steps to 4; zero config errors in 5 straight activities |
Core principle
Before: Can this be quantified? What metric measures it?
During: Record the baseline (before)
After: Compare with the results (after)
If you can’t even establish a metric, seriously ask yourself: does this work really need to be done? Much “tech debt” is debt that “looks like it should be paid, but nobody actually feels the pain”. No metric means no pain; no pain means low priority. Rather than spending three days refactoring a module nobody complains about, spend the time on work that produces data.
In one sentence: dirty work that can create metrics is an optimization; dirty work that can’t is self-indulgence. When reporting, “I optimized X, metrics up YY%” is far more convincing than “I refactored X”.
6. Small Expression Tricks
6.1 Lead With the Conclusion, Cut the Setup
❌ As the business grew rapidly, user volume kept rising, and to improve the user experience, we optimized the activity page's performance...
✅ Activity page first screen 67% faster: LCP 1.06s → 348ms.
The leader doesn’t care about that long opening. Give the conclusion first; if they’re interested, they’ll ask about the context.
6.2 Start With a Verb, Show Ownership
❌ Was responsible for the activity page performance optimization
✅ Led the performance optimization, found 3 core bottlenecks, first screen 67% faster
“Was responsible for” is passive; “led” is active. The words you report with define your position in the organization.
6.3 If You Can Say It in One Sentence, Don’t Write Three Paragraphs
Reporting isn’t a thesis. Brevity = respect for the other person’s time = professionalism.
7. About “The Person Who Writes PPT Got Promoted”
Back to the opening question. Yes, people who report well are easier to see. But that doesn’t mean you should become someone who only writes PPTs.
The real formula:
Ability × Being Seen = Influence
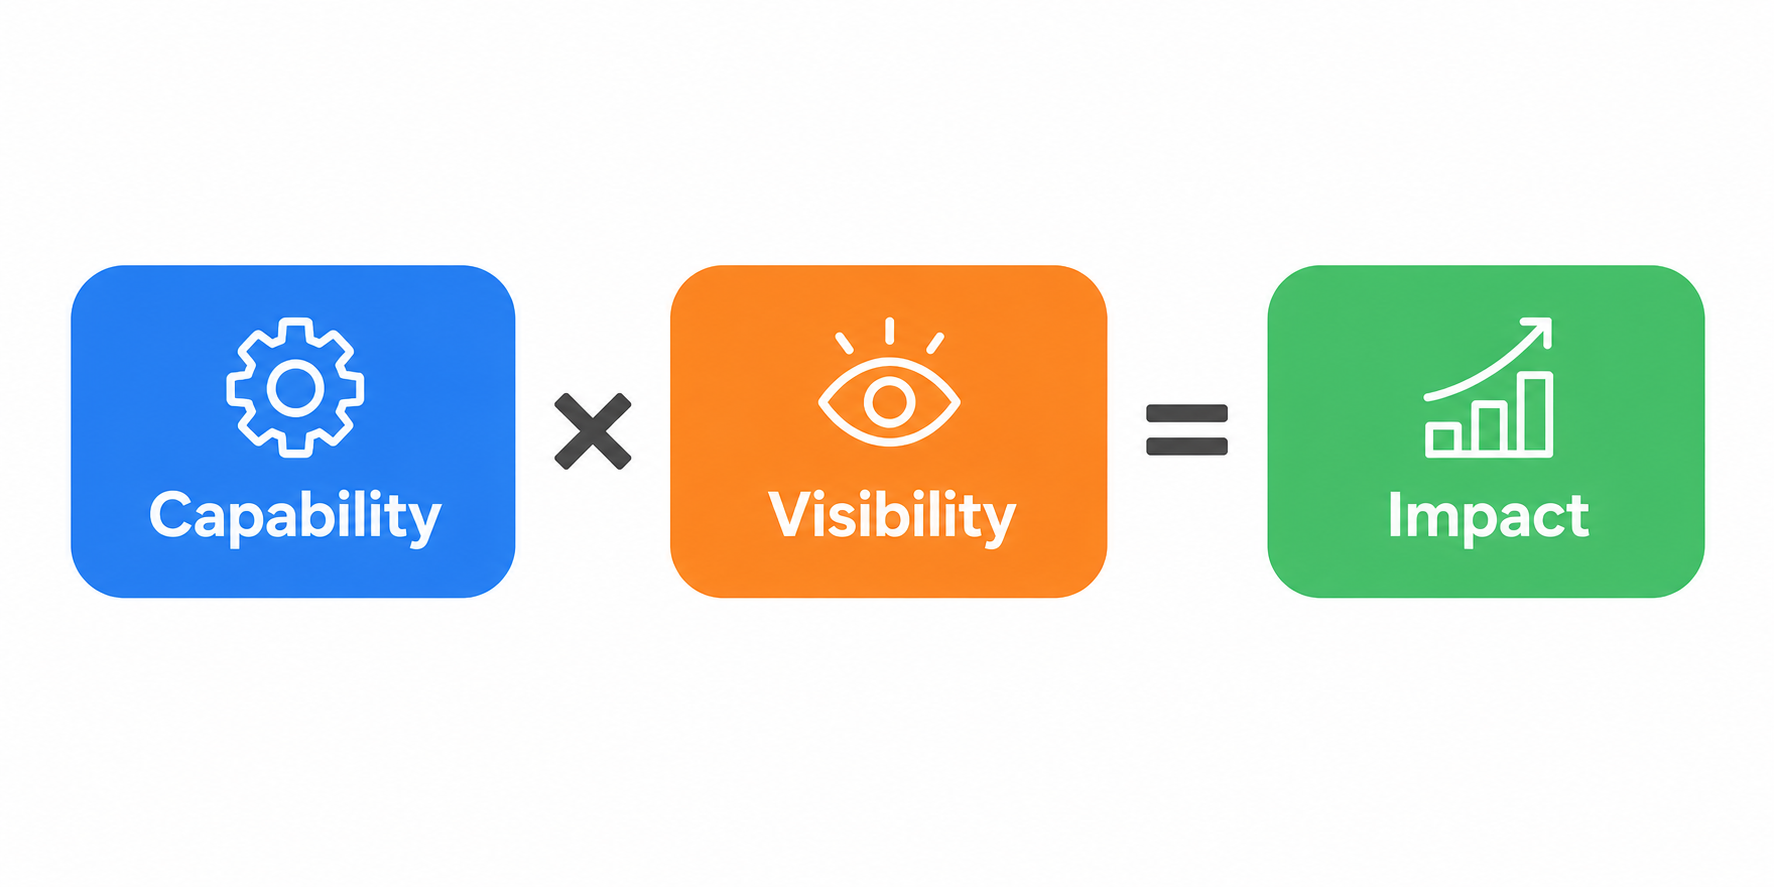
If ability is 0, no amount of reporting makes it 10. If ability is 1, good reporting can make it 10. Before complaining that “doers aren’t rewarded like talkers”, make sure you’re not bad at both sides.
8. Summary
Good reporting:
✅ Conclusion first — grabs the point in 30 seconds
✅ Data with baselines and business meaning
✅ Lean on process, loud on results
✅ Clear next steps, proactive about risks
✅ Dirty work has metrics — with metrics it's an optimization, without it's self-indulgence

Bad reporting:
❌ Ledger-style, no focus
❌ Effort without outcome
❌ Data dump without interpretation
❌ No action plan
❌ Did dirty work but can't articulate its value
Remember one sentence: reporting = what I did + what effect it had + what’s next. Get those three things clear and you’re ahead of 80% of people. The remaining 20% comes from consistent practice.